Do you understand how risk management data flows through your organization, arrives at your desk in a useful manner, and hopefully, contributes to good decisions all over your company? Defining the way that information moves in a company or other organization may help provide you with insights about ways the process can be streamlined and made more efficient and effective. This risk management data flow could be independent of any computer systems (or lack of them) to begin with. Of course, the right risk analytics software technology can make this entire process more efficient and productive.
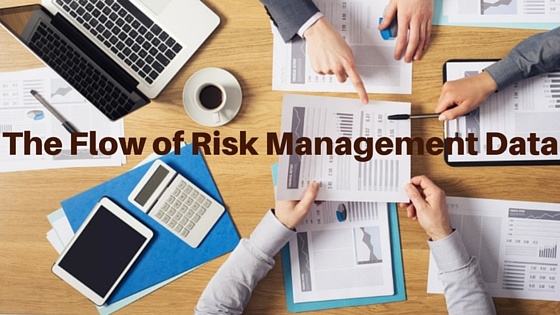
A Risk Management Data Flow Example
To help illustrate how this information might flow through a company, it's interesting to look at a chart of risk data that was created by the Process Management Institute. This particular analysis deals with the steps that data flows through from initially identifying a problem to either taking action to mitigate the problem or managing the risk of the problem.
Problem identification: This could come from an incident report or even employee feedback about a potential safety hazard. Once the problem has been identified, it can be confirmed and moved on to the next step. Depending upon the problem and quality of information, the next step might include taking further action, performing more research and analysis, or sending it on to a high-level decision maker.
Problem with a known solution: If the problem is easy to solve, this step simply means that the the next piece of information that must be recorded is the action step to resolve it. Problems like these could include those that have caused several incidents and could be easily remediated with better communication or the replacement or repair of equipment.
Problem that requires further analysis: This box in the flow chart represents risk data that pinpoints a problem that isn't so easy to solve. Risk data might need to be moved along to management or consultants to review before action can be taken. In some cases, more information might be required before making a good decision.
Urgent issue with imperfect answers: In these cases, there might not be a perfect solution to totally mitigate the hazard. These could be hazards that are either very expensive to remediate or totally out of the company's control. Assumptions might have to be made about how to best minimize or manage the risk. This could also indicate a problem that is only described by low-quality data that needs to be improved.
In the flow chart, the risk data analysis process gets documented like this:
- Identify problems
- Analyze problems
- Prioritize risks
- Plan to mitigate risks
- Control the risks
- Monitor outcomes
Of course, risk management software can help streamline the entire risk management data flow. At the same time, these solutions help improve the quality of both data and data reports to help everybody involved in the process make better decisions.
See How We Can Help Improve the Flow of Risk Management Data
At Ventiv Technology, our technology helps hundreds of thriving companies improve the quality and flow of data within their organization. Contact us to learn how we can help you improve the quality and management of your company's important risk data.