Menu

- Products
- Our Solutions
- Advanced Analytics
- Billing
- Broker Portal
- Claims Management
- Core Claims Administration
- Data Governance
- Data Science
- Data Visualization
- Enterprise Risk Management
- Environment Health & Safety
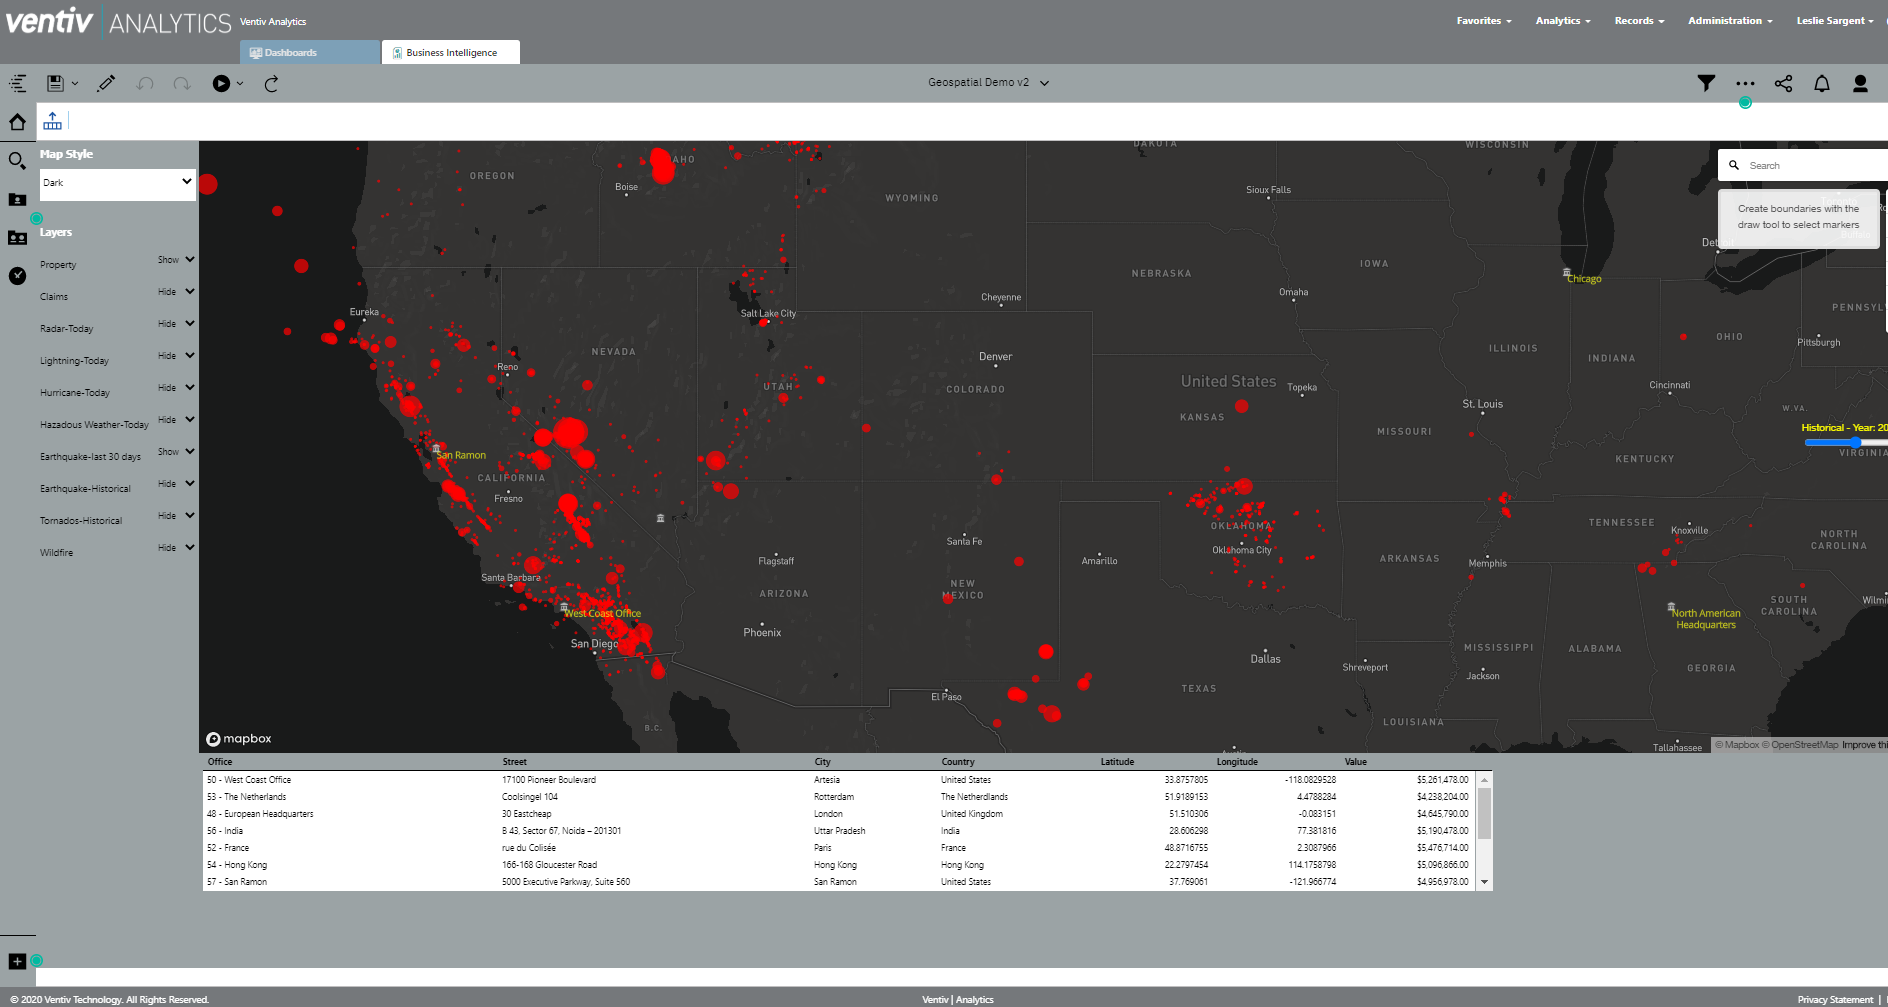
- Geospatial Analytics
- Hosting
- Intake & Mobile
- Integrated Risk Management
- Legal Matter Management
- Medical Professional Liability
- Patient Safety
- Predictive Analytics
- Renewal Management
- Risk Management Information
- Robotic Process Management
- Underwriting and Policy Issuance
- Your Needs
- Who We Are
- Resources