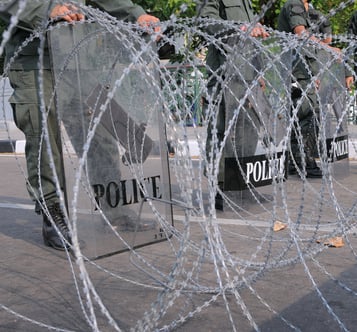
Whether it’s natural disasters, supply chain interruptions, or public unrest, there’s no shortage of unforeseen events that can impact your risk profile. But by using geospatial analytics, you can foretell risk based on geographic and event data.
By analyzing the locations of certain kinds of risks, you can make sound risk decisions that support operations and reduce your total cost of risk.
What Are Geospatial Analytics?
Geospatial analytics involves extracting business-critical insights by analyzing geographic data. From the perspective of risk management, a geospatial solution helps you visualize the likelihood of risk events based on historical and real-time data.
How Geospatial Analytics Enable You to Prepare for the Future
Geospatial analytics puts you in a position to prepare for future events by giving you a glimpse into the kinds of risks inherent to particular locations. When you consider each area, its risks, and how this could impact your business, you can derive powerful strategic insights. Here are some ways you can put geospatial analytics to work for your business.
Identify Vulnerabilities Ahead of Time
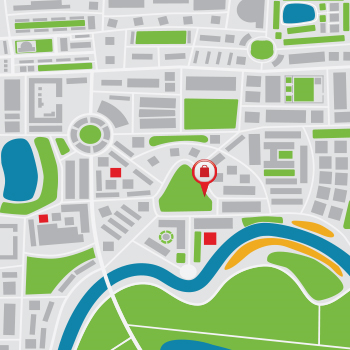
Geospatial analytics make it easier to identify vulnerabilities because they enable you to connect risk data with specific locations. This is because, with a geospatial solution, you can overlay a range of datasets onto maps.
For example, you can look at a geospatial map and see which business locations are in flood zones. Then, on the same screen, you can see the financial impacts of previous flooding in those areas.
With this data, you can evaluate your flood coverage, and, if necessary, increase it to mitigate the potential financial fallout.
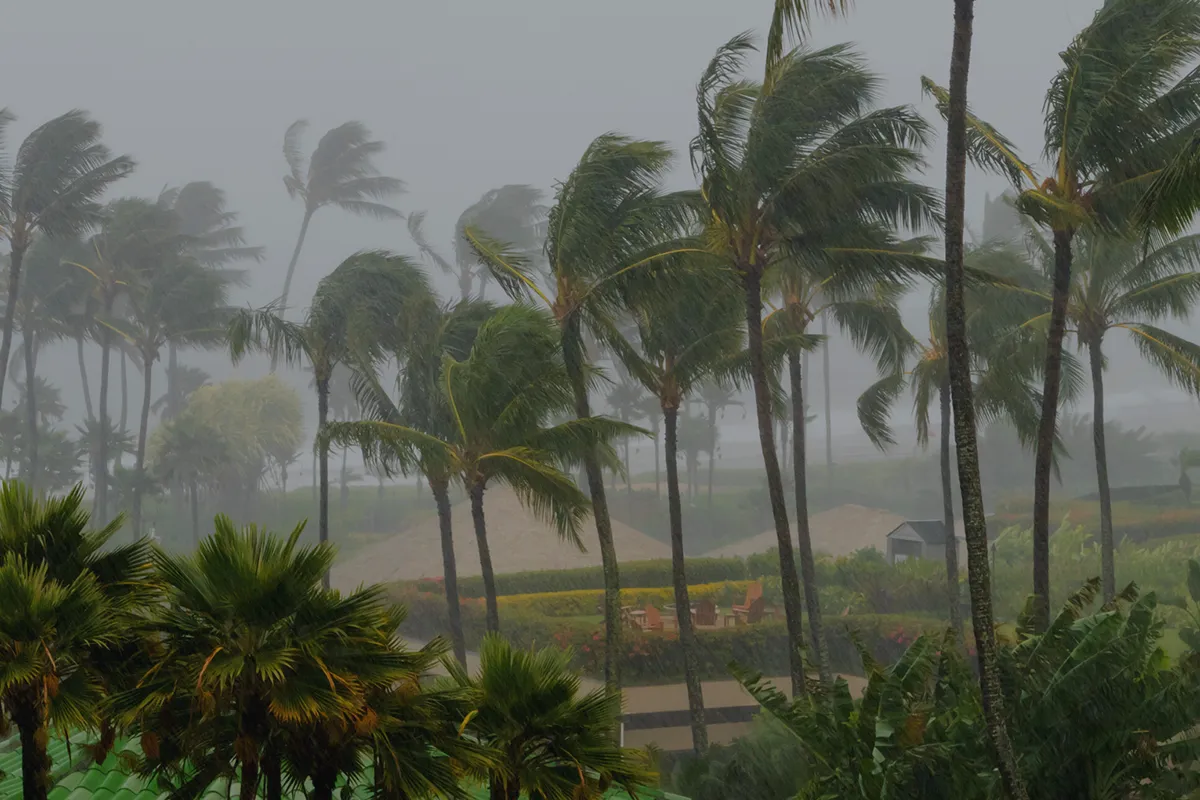
Prepare for Natural Disasters
With geospatial analytics, you have the ability to identify which natural disasters are most likely to impact your area and then plan accordingly.
To illustrate, suppose wildfires have been raging in your state, and you want to know whether you should increase your fire coverage. In a few moments, you can pull up a map that shows the exact locations and severity of wildfires over the last several years.
With this data, you can:
- Determine the likelihood of one occurring in your area
- See the financial impact of previous wildfires
- Analyze how the location and intensity of fires have evolved over time
In this way, geospatial analytics takes the guesswork out of risk mitigation, replacing it with actionable data.
Make Your Supply Chain More Resilient
Recent events have exposed the fragility of supply chains and how this can impact operations and revenue. But by using geospatial analytics, you can prepare for possible supply chain interruptions and mitigate them months or years in advance.
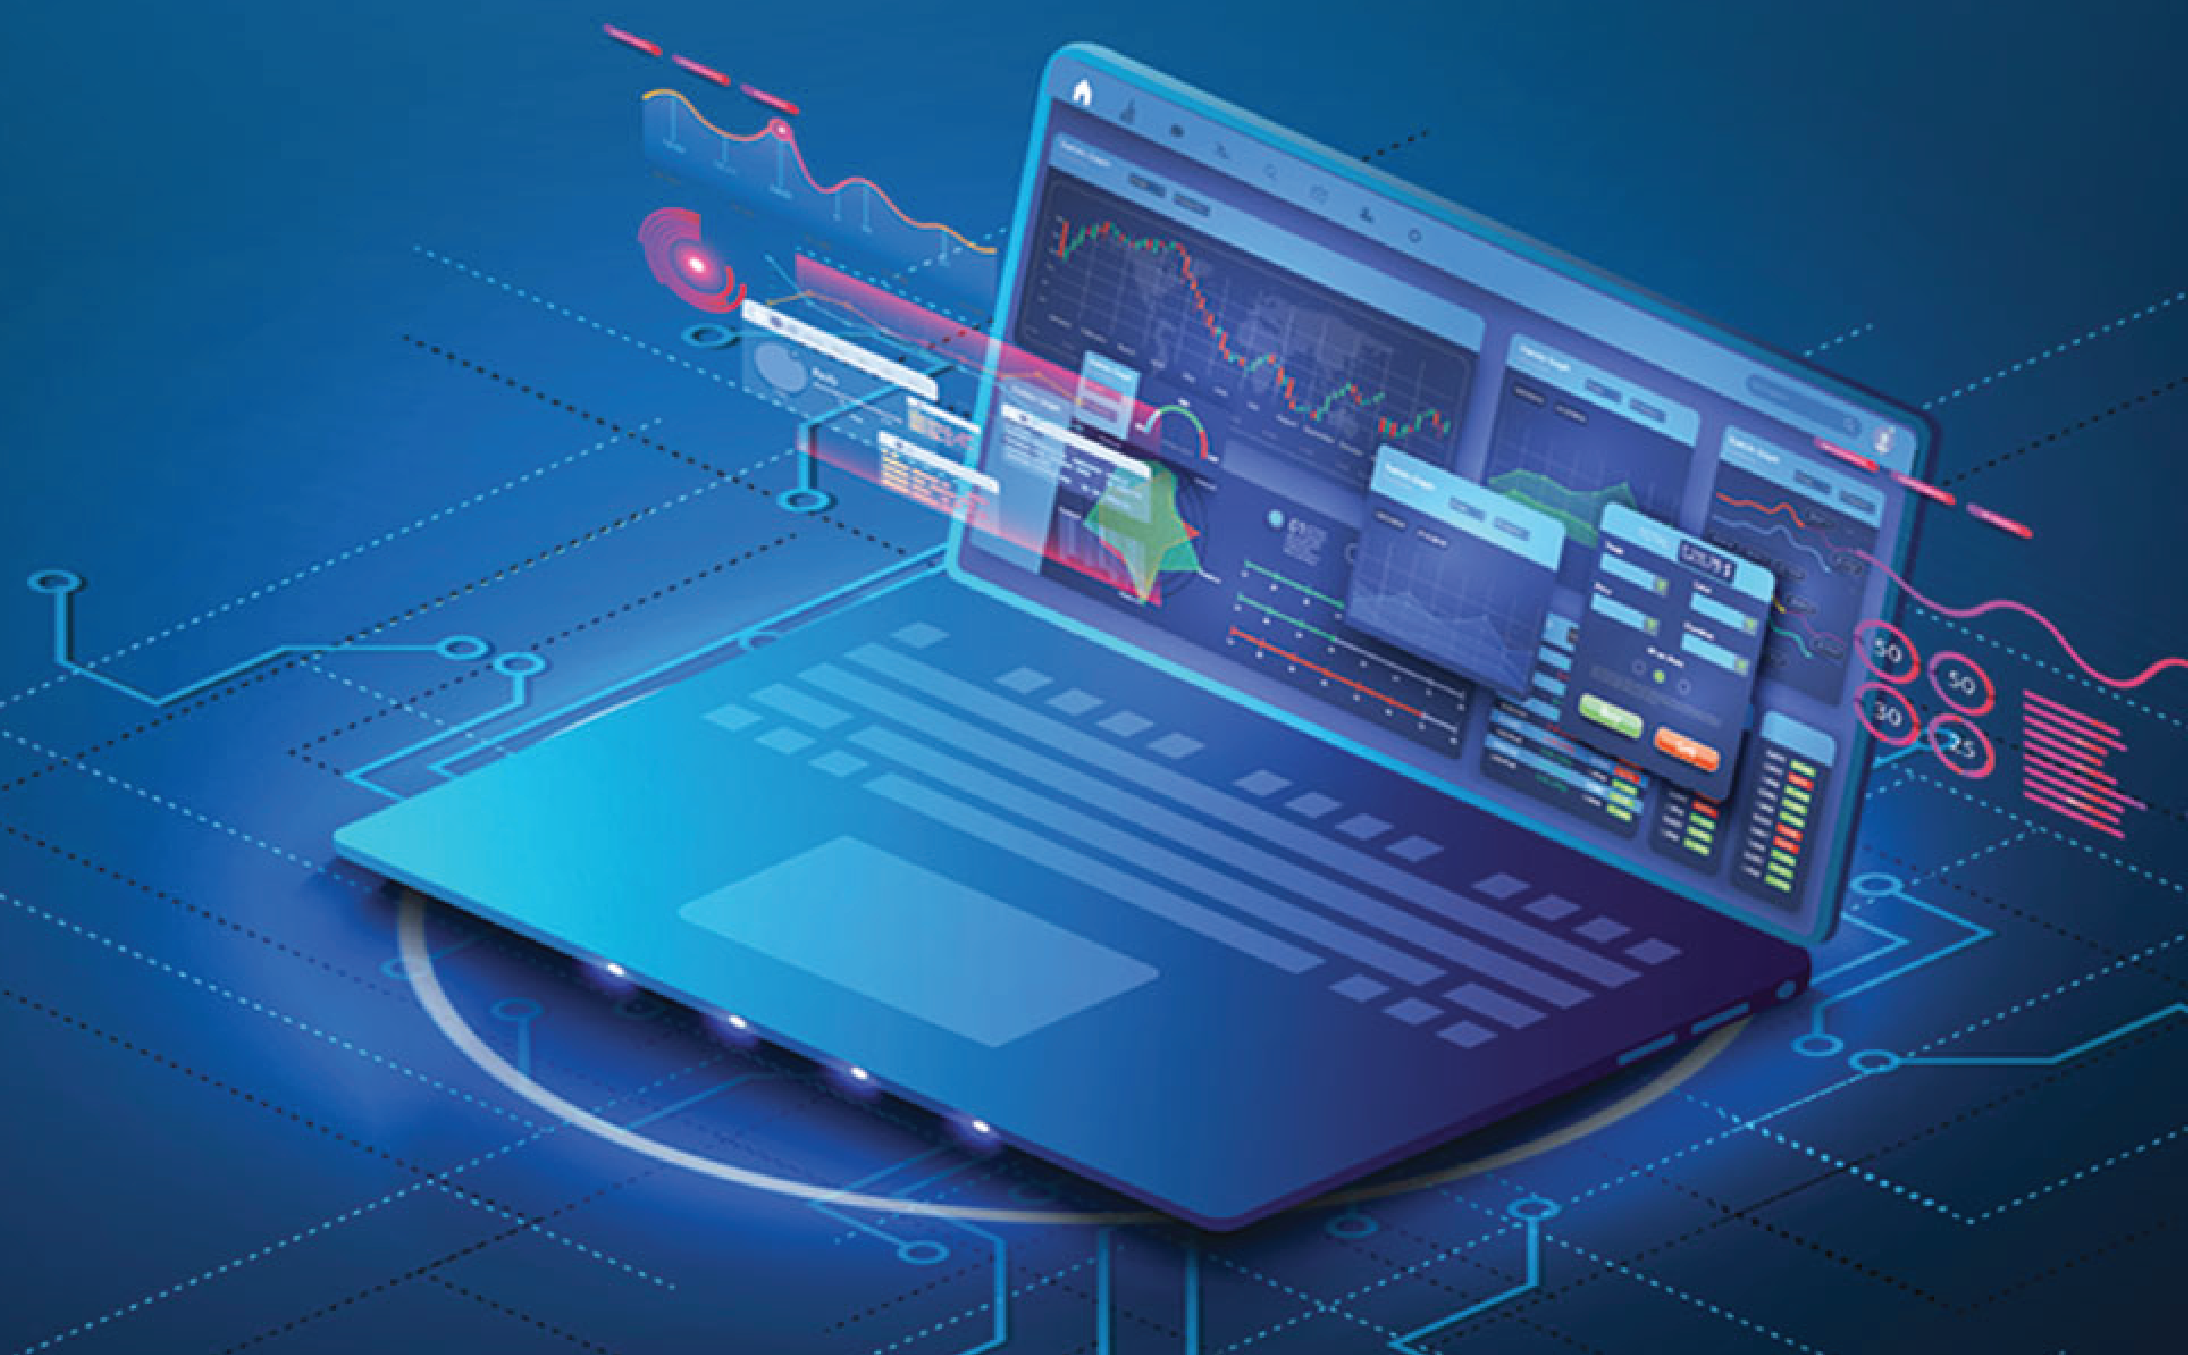
For instance, suppose you’re a manufacturer in Michigan that sources parts from northern California. You pull up a map, such as Ventiv Geospatial, and examine the major snow storms that occurred over the past few years between northern California and Michigan.
You find that even though northern California was spared, Wyoming, South Dakota, and Minnesota had some severe storms that could have brought shipping to a halt.
With this data on your laptop screen, you sit down with another decision-maker and decide to reach out to suppliers in other areas of the country, especially those that wouldn’t have to send their goods through the northern states during the winter. You then formulate a mitigation strategy that involves checking each supplier’s inventory levels periodically so you know whether they have the stock you need, especially before a major storm hits.
This information enables you to not only keep operations running smoothly, but to also reduce your supply chain insurance, particularly your natural disaster coverage.
Adjust for Climate Change Before It Impacts Your Business
Climate change affects all businesses differently, depending on their locations, and this is where geospatial analysis can save you considerable money. Some effects of climate change can be hard to predict, while others are relatively easy to see, especially with the help of a geospatial analysis tool.
For example, scientists have proven that there's a connection between ocean surface temperatures and the severity of tropical storms and hurricanes. The higher the temperature of the water, the more energy produced by each sea-born storm.
If you have operational centers in hurricane-prone areas, you can check the water temperatures in those regions. You can also compare them to:
- Atmospheric temps in nearby areas
- Water temperatures off the west coast of Africa, where hurricanes often start developing
- Historical data about the frequencies of tropical storms and hurricanes
If any correlations jump off the screen, you can use this information to reassess your storm coverage. For instance, certain patterns of high water and atmospheric temps may tend to produce more storms at particular times of the year. If current data aligns with your analysis, it may be time to increase your coverage.
For some organizations, it may be possible to use geospatial analysis to time insurance renewals. To illustrate, you could start your coverage shortly after a date when you have the most compelling geospatial data, such as at the start of hurricane season. You can then optimize the effectiveness of your coverage by tailoring your renewal decisions according to your geospatial data.
With Ventiv Geospatial, you have the data you need to respond effectively, prepare for catastrophes, make well-informed risk decisions, and lower the costs of claims.
Chat with an expert to see how Ventiv’s Geospatial Solution is right for your organization or if you would like more information, check out our whitepaper - Ready or Not: Preparing for the Unexpected - How GIS and AI are helping risk managers and insurers respond to catastrophe claims.
.